
Exploratory Data Analysis | Python | Business Analytics | Marketing Analytics | Data Visualization
Project Overview
How do New York City's Business Improvement Districts allocate resources, deliver services, and engage with their communities?
This independent project explores financial, operational, staffing, sanitation, public-safety, and marketing data from 76 Business Improvement Districts (BIDs) across New York City's five boroughs.
Using Python and statistical analysis, I examined reported BID activities, compared resource allocation across boroughs, developed normalized measures, and explored relationships between digital audiences, event attendance, and financial indicators.
The objective was to translate reported data into meaningful insights while recognizing differences in district characteristics, reporting practices, and data availability.
Project at a Glance
76 BIDs analyzed across five boroughs
69,454 BID-reported individual businesses
10 analytical findings covering financial, operational, and marketing indicators
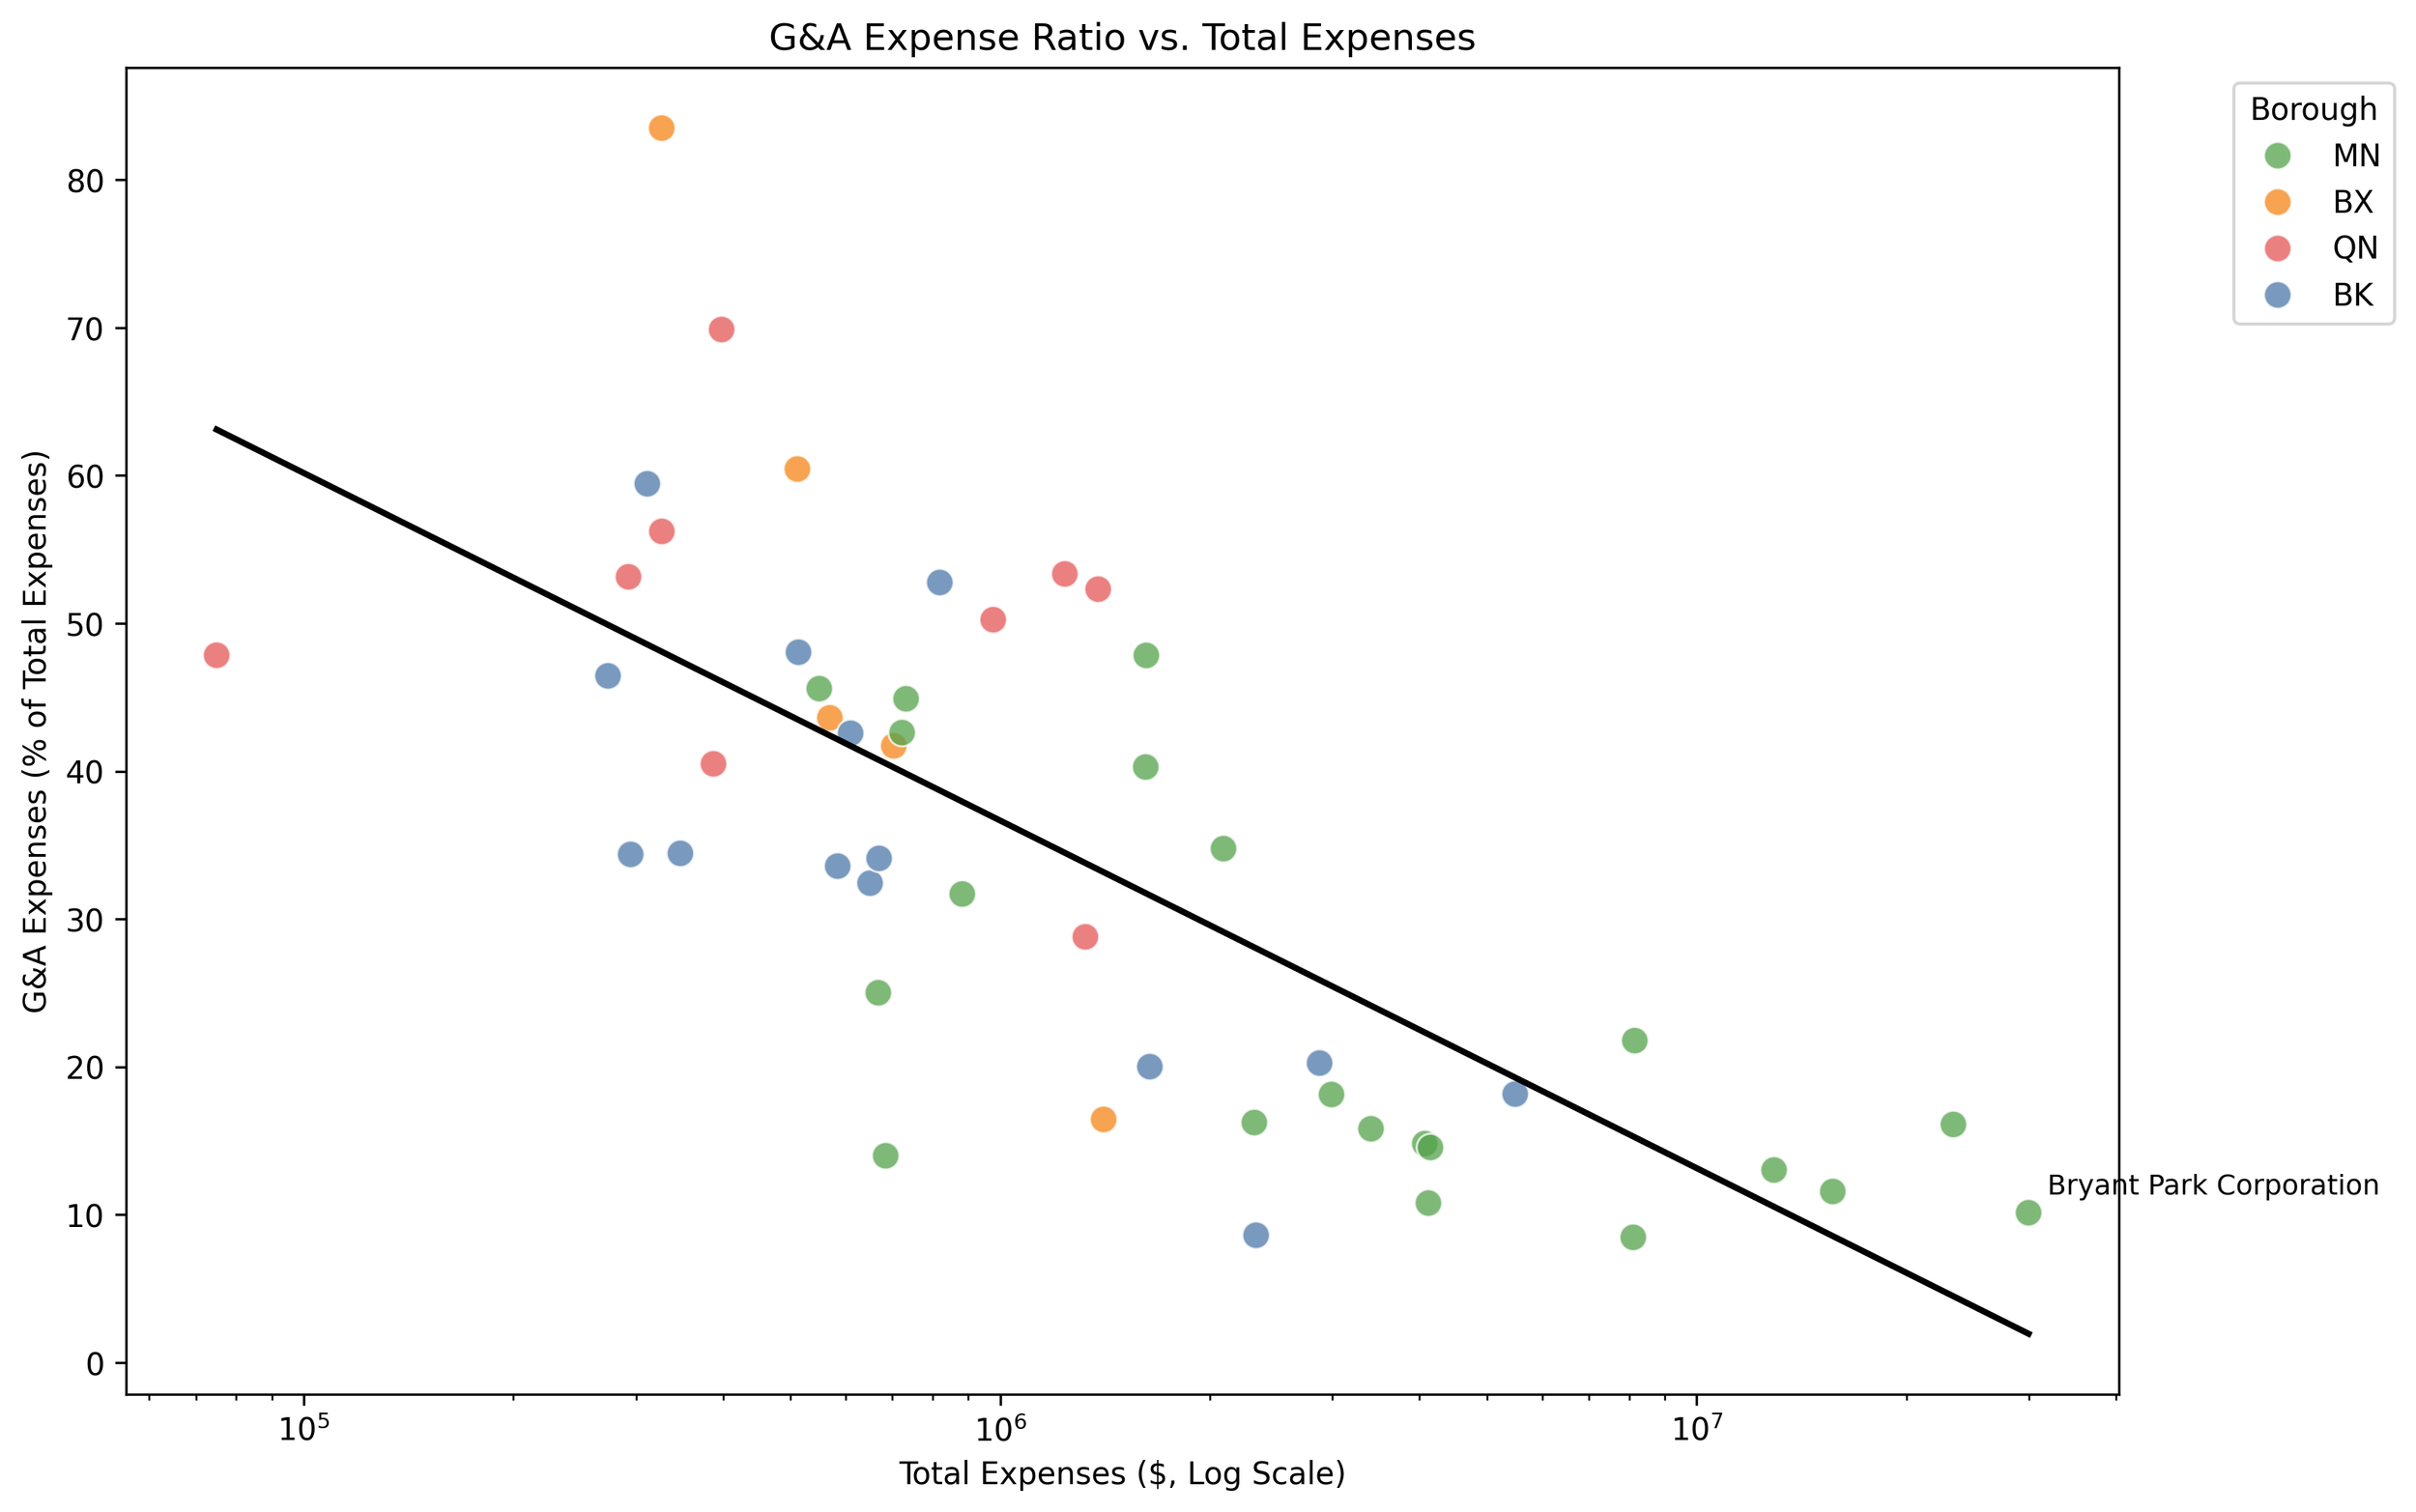
49 BIDs with complete reporting across all six G&A expense categories
Key Questions
The analysis focused on several business and operational questions:
How does reported financial activity vary across boroughs?
How do BIDs allocate resources toward sanitation and streetscape services?
How do reported staffing levels compare relative to service-area size?
What relationships exist between marketing indicators, digital audiences, and event attendance?
How dependent are BIDs on assessment revenue?
What can reported administrative expenses reveal about BID financial structures?
Selected Findings
Resource Allocation
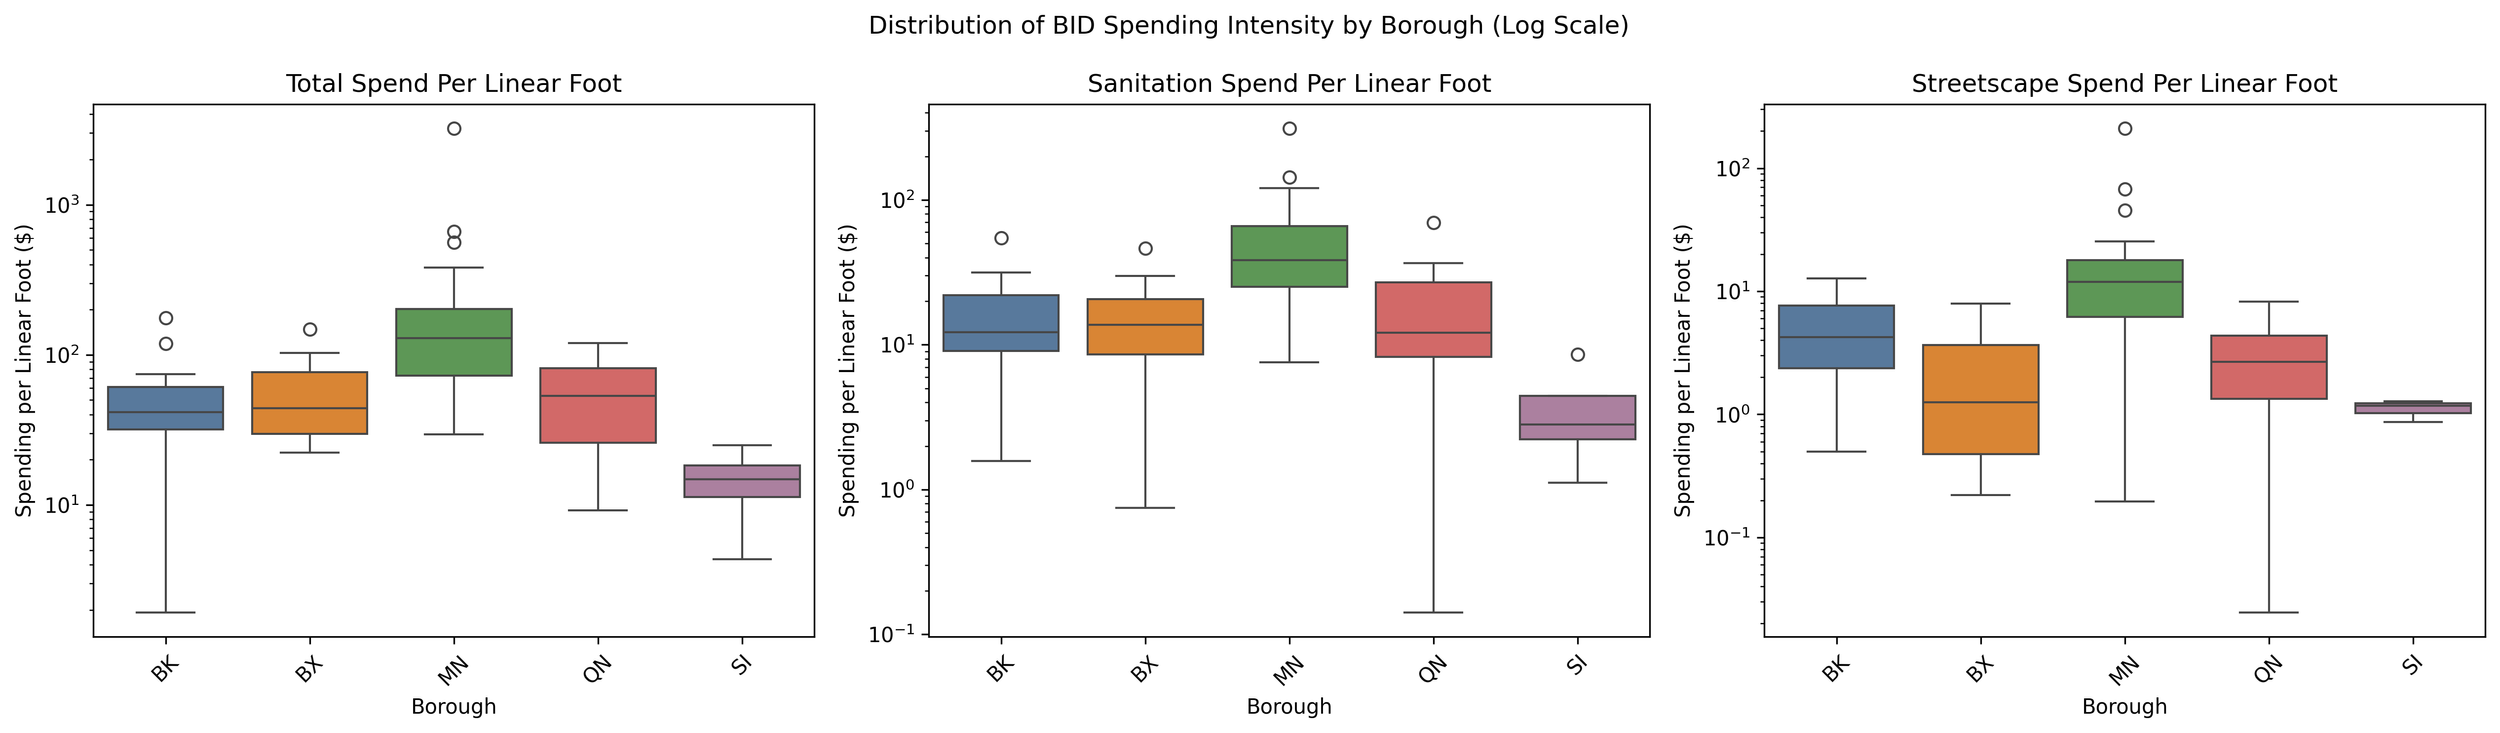
Manhattan had the highest median total spending, sanitation spending, and streetscape spending per linear foot. These comparisons highlight differences in reported resource intensity across boroughs, rather than differences in service quality or operational efficiency.
Marketing and Community Engagement
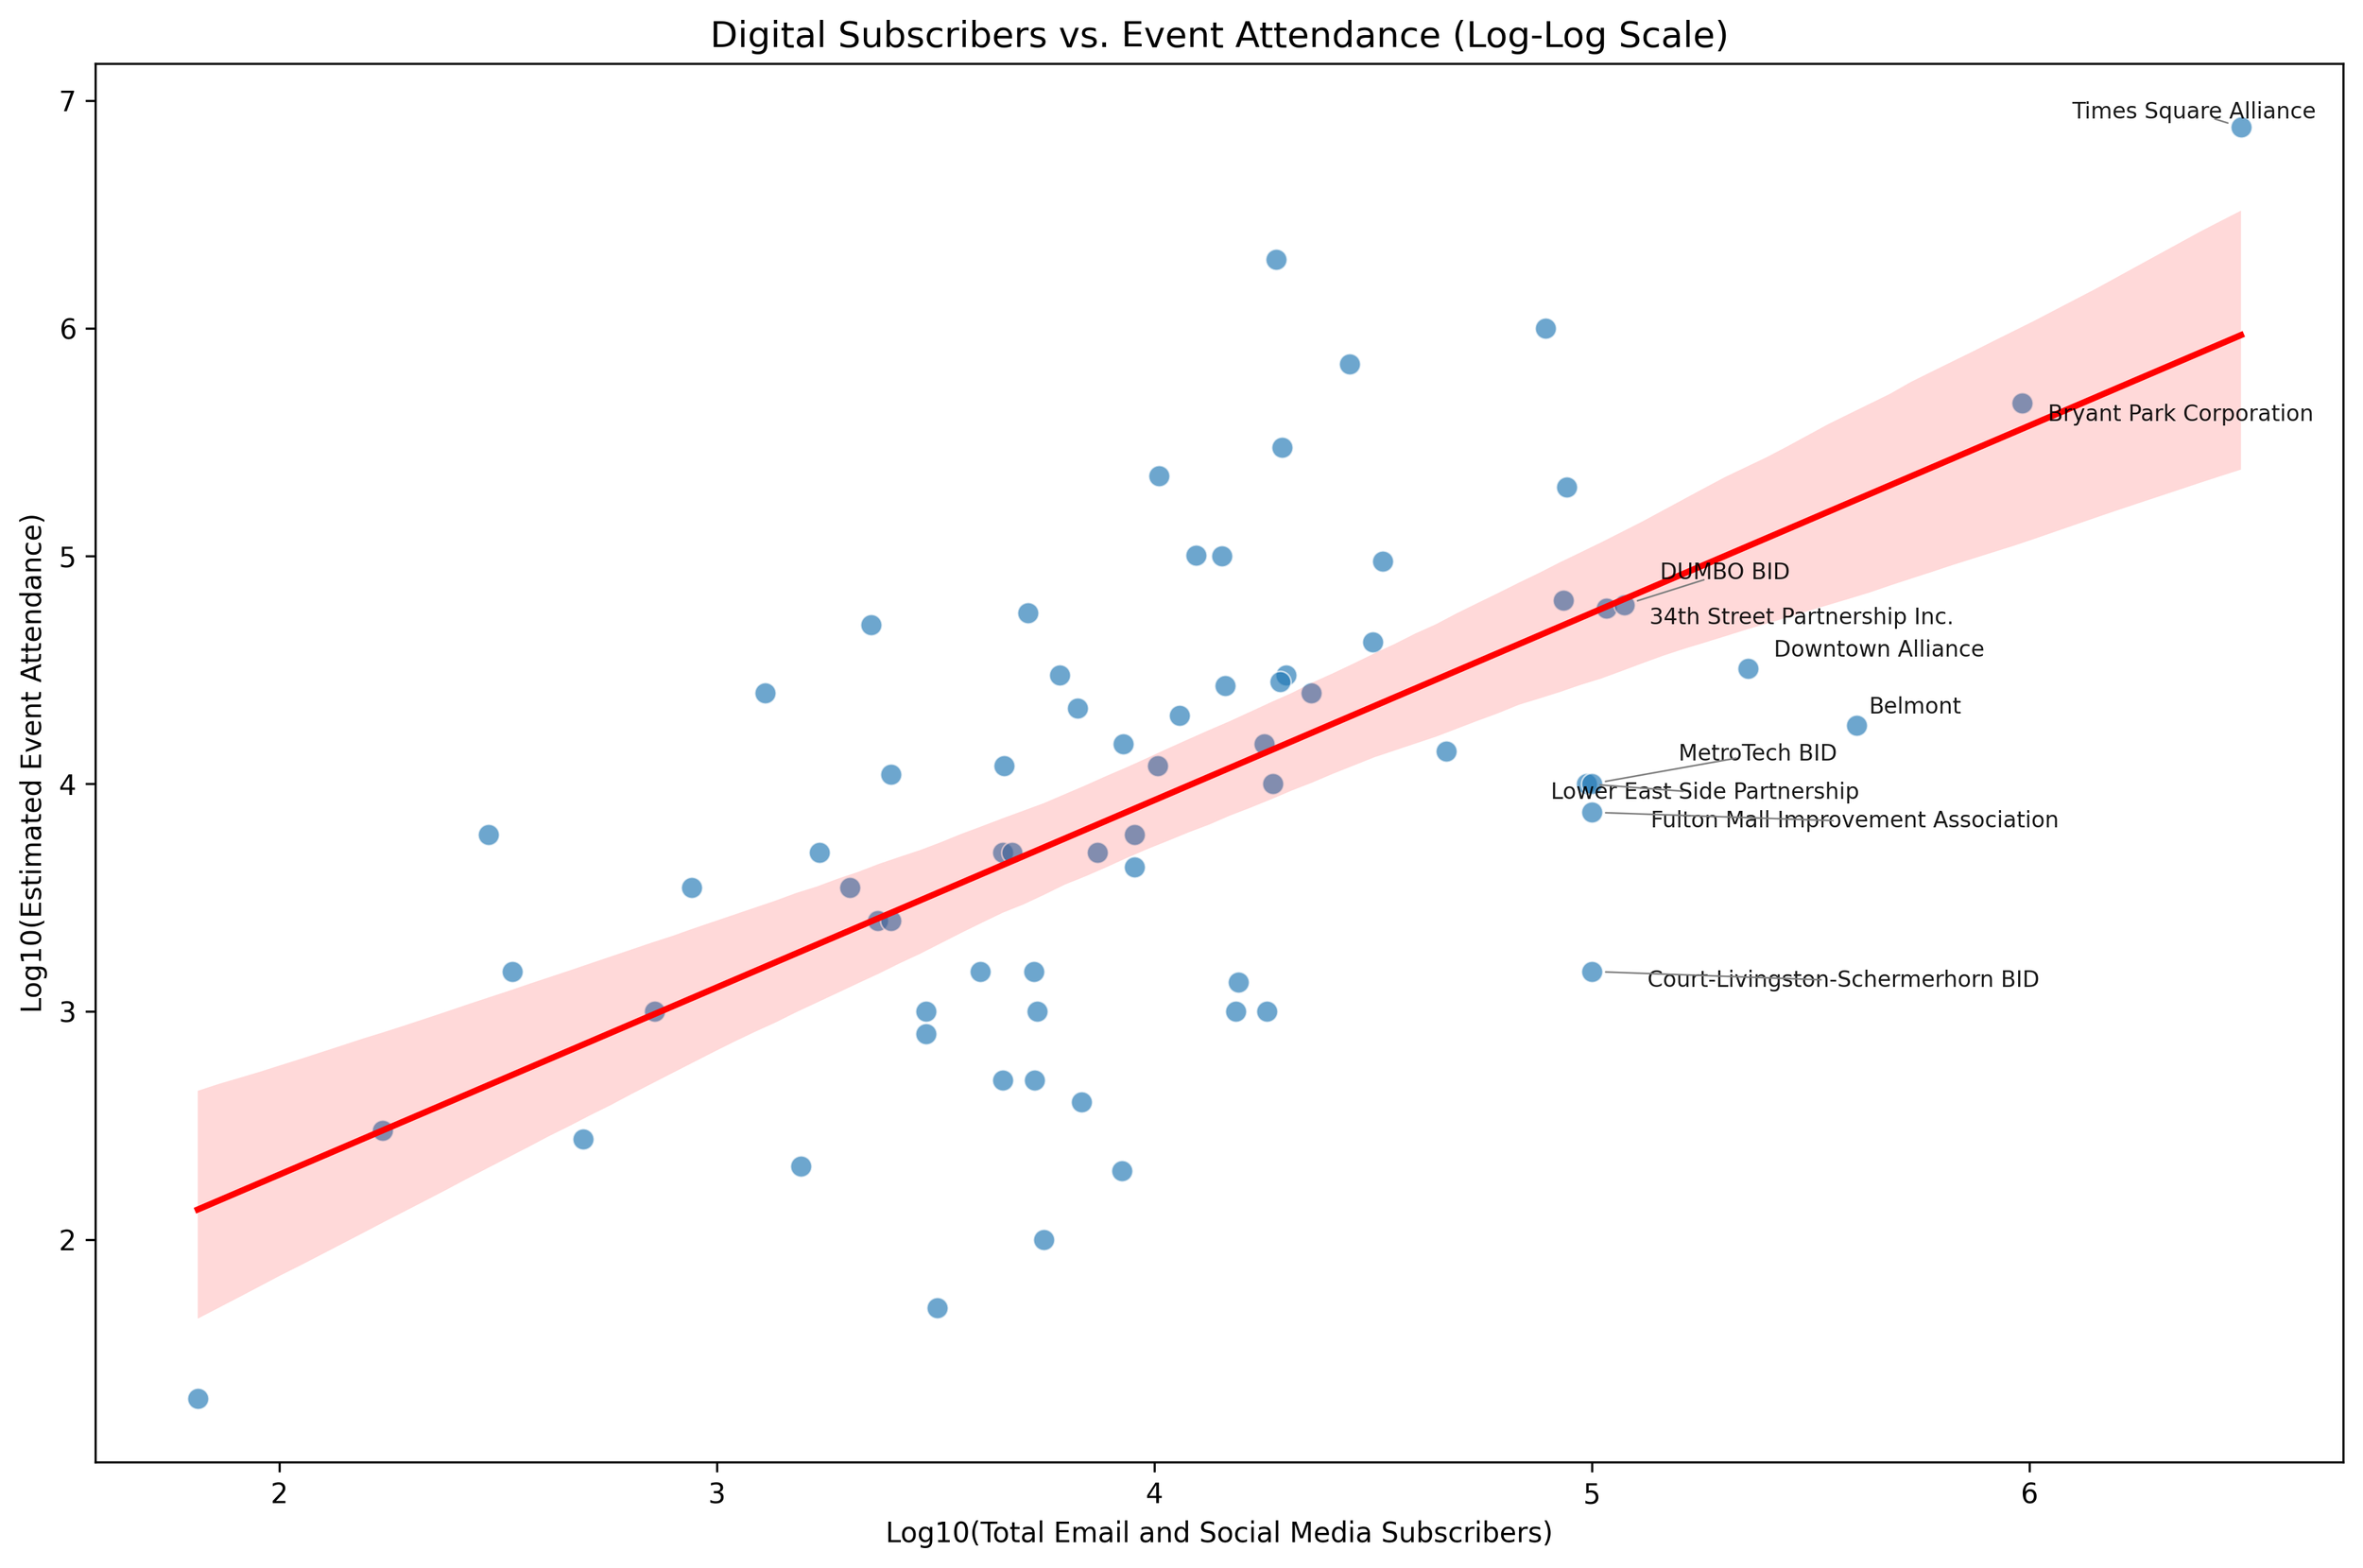
Marketing materials distributed showed virtually no original-scale linear correlation with estimated event attendance. Digital subscribers, however, showed a strong original-scale correlation with attendance (r = 0.917).
After excluding Times Square Alliance, the original-scale correlation decreased to 0.162, illustrating the influence of extreme observations and the importance of examining statistical relationships across different measurement scales.
Staffing and Service Delivery
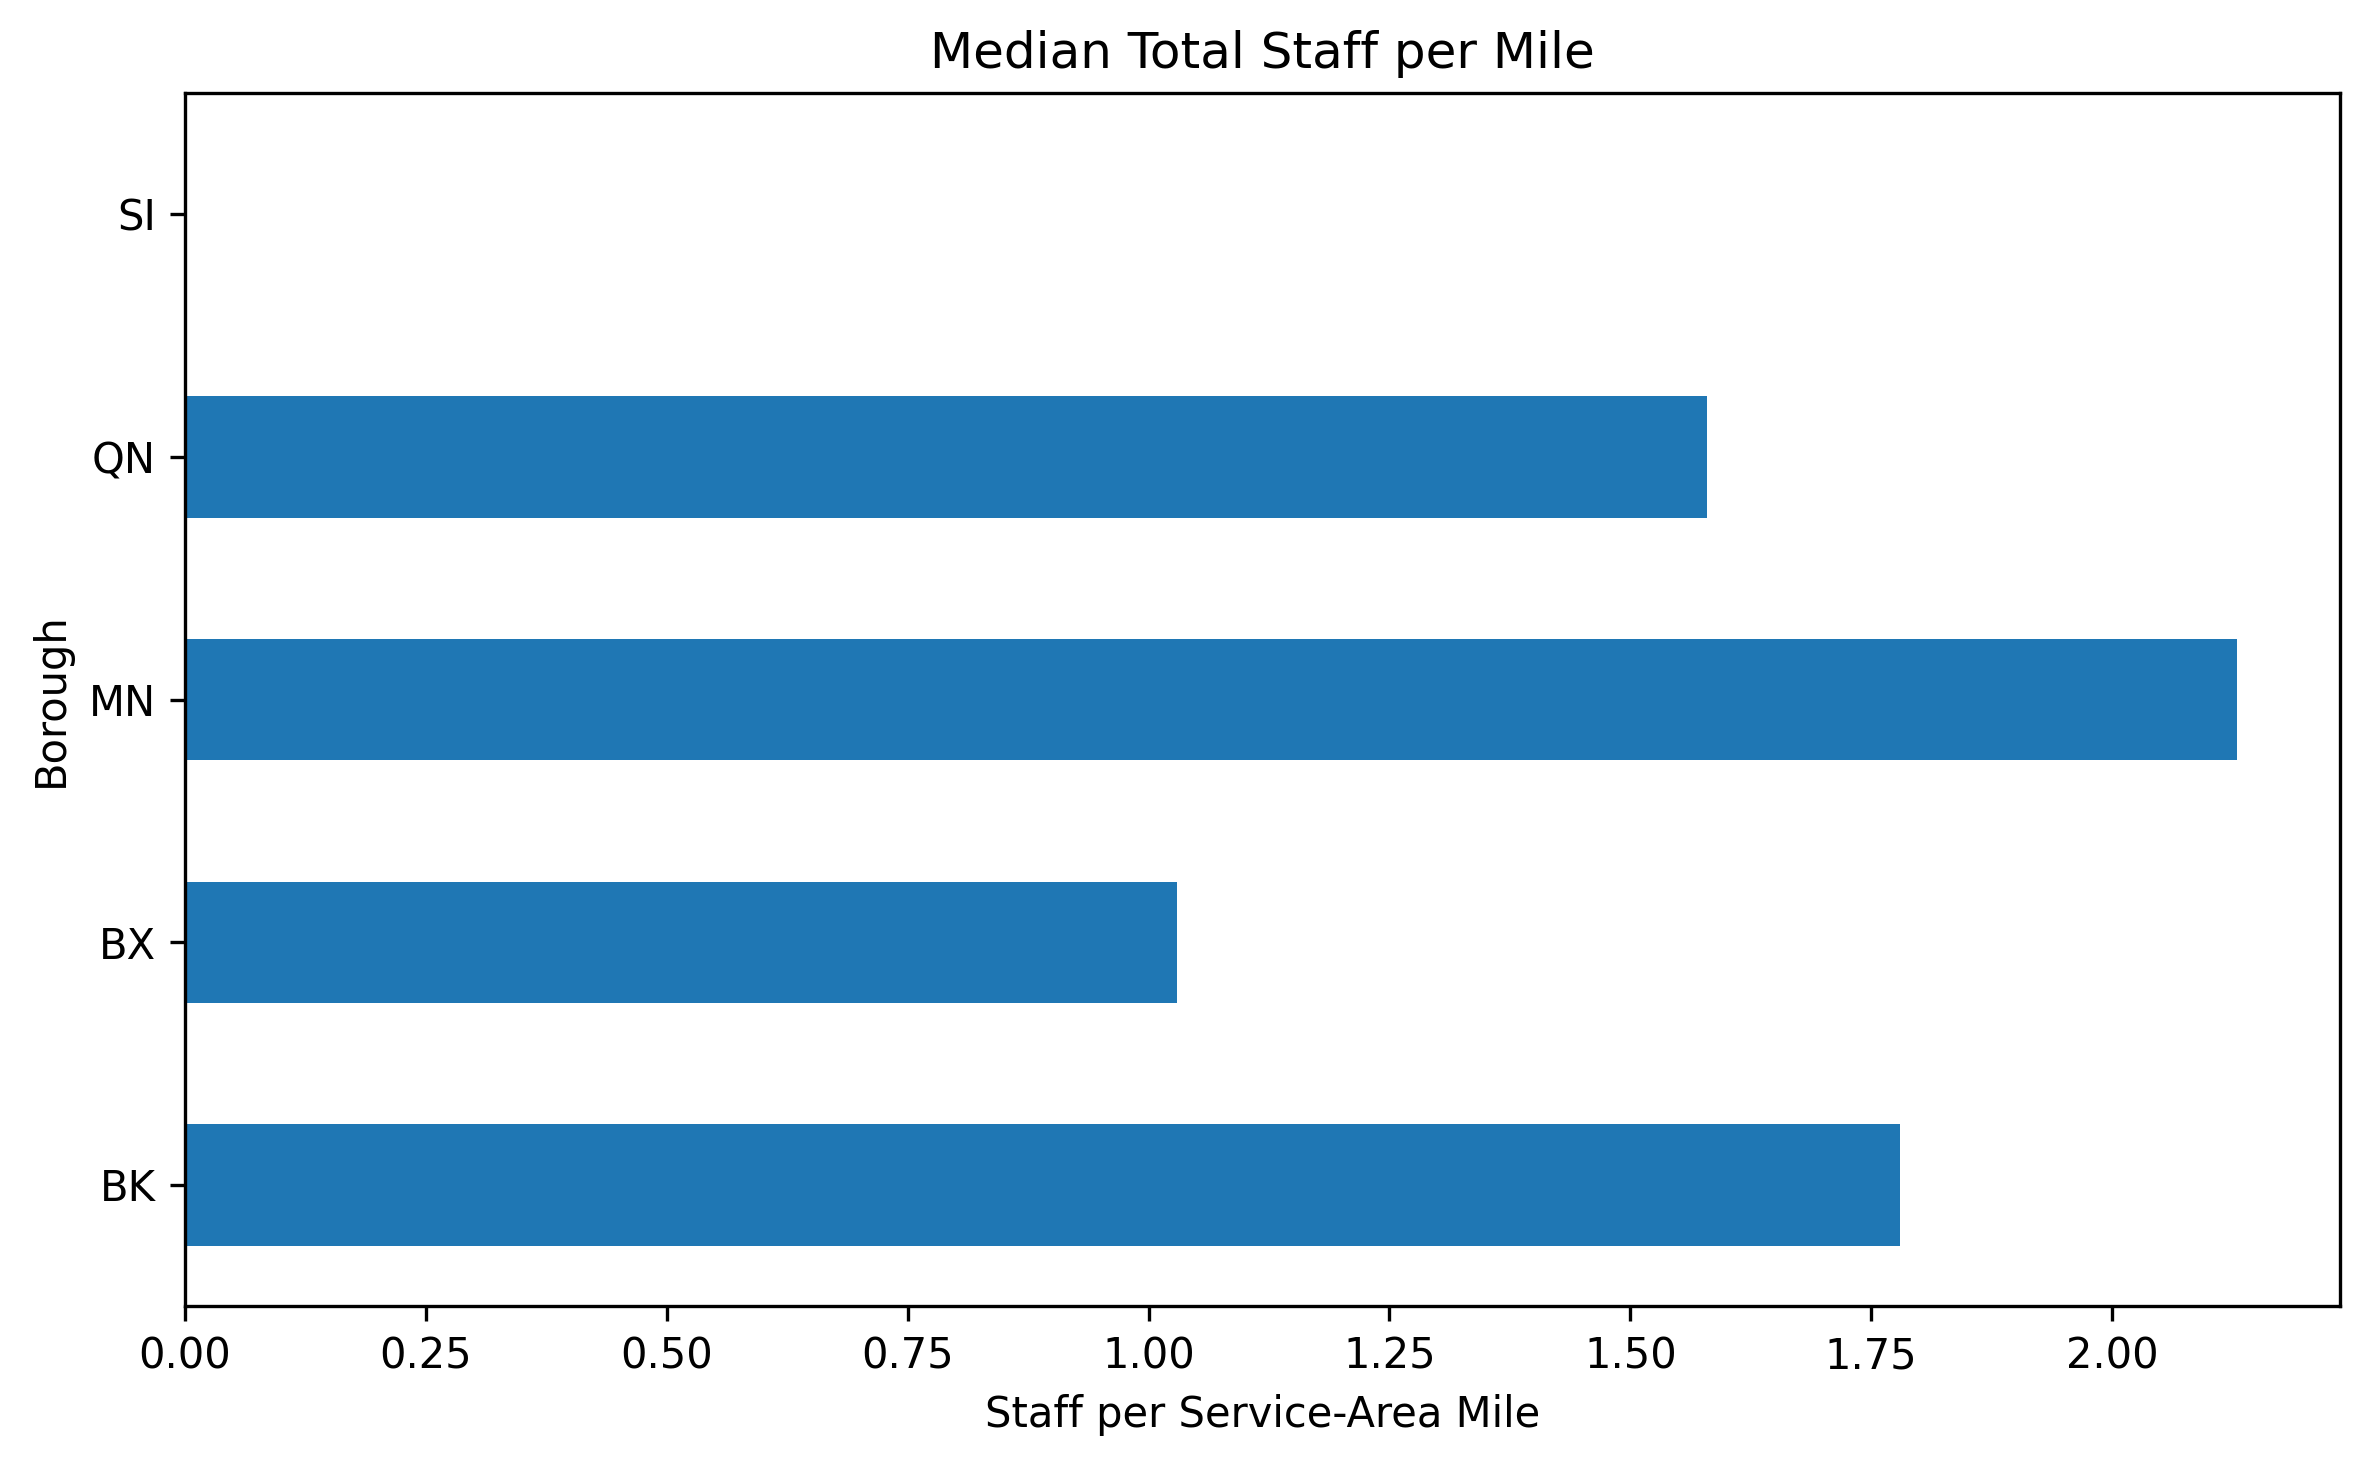
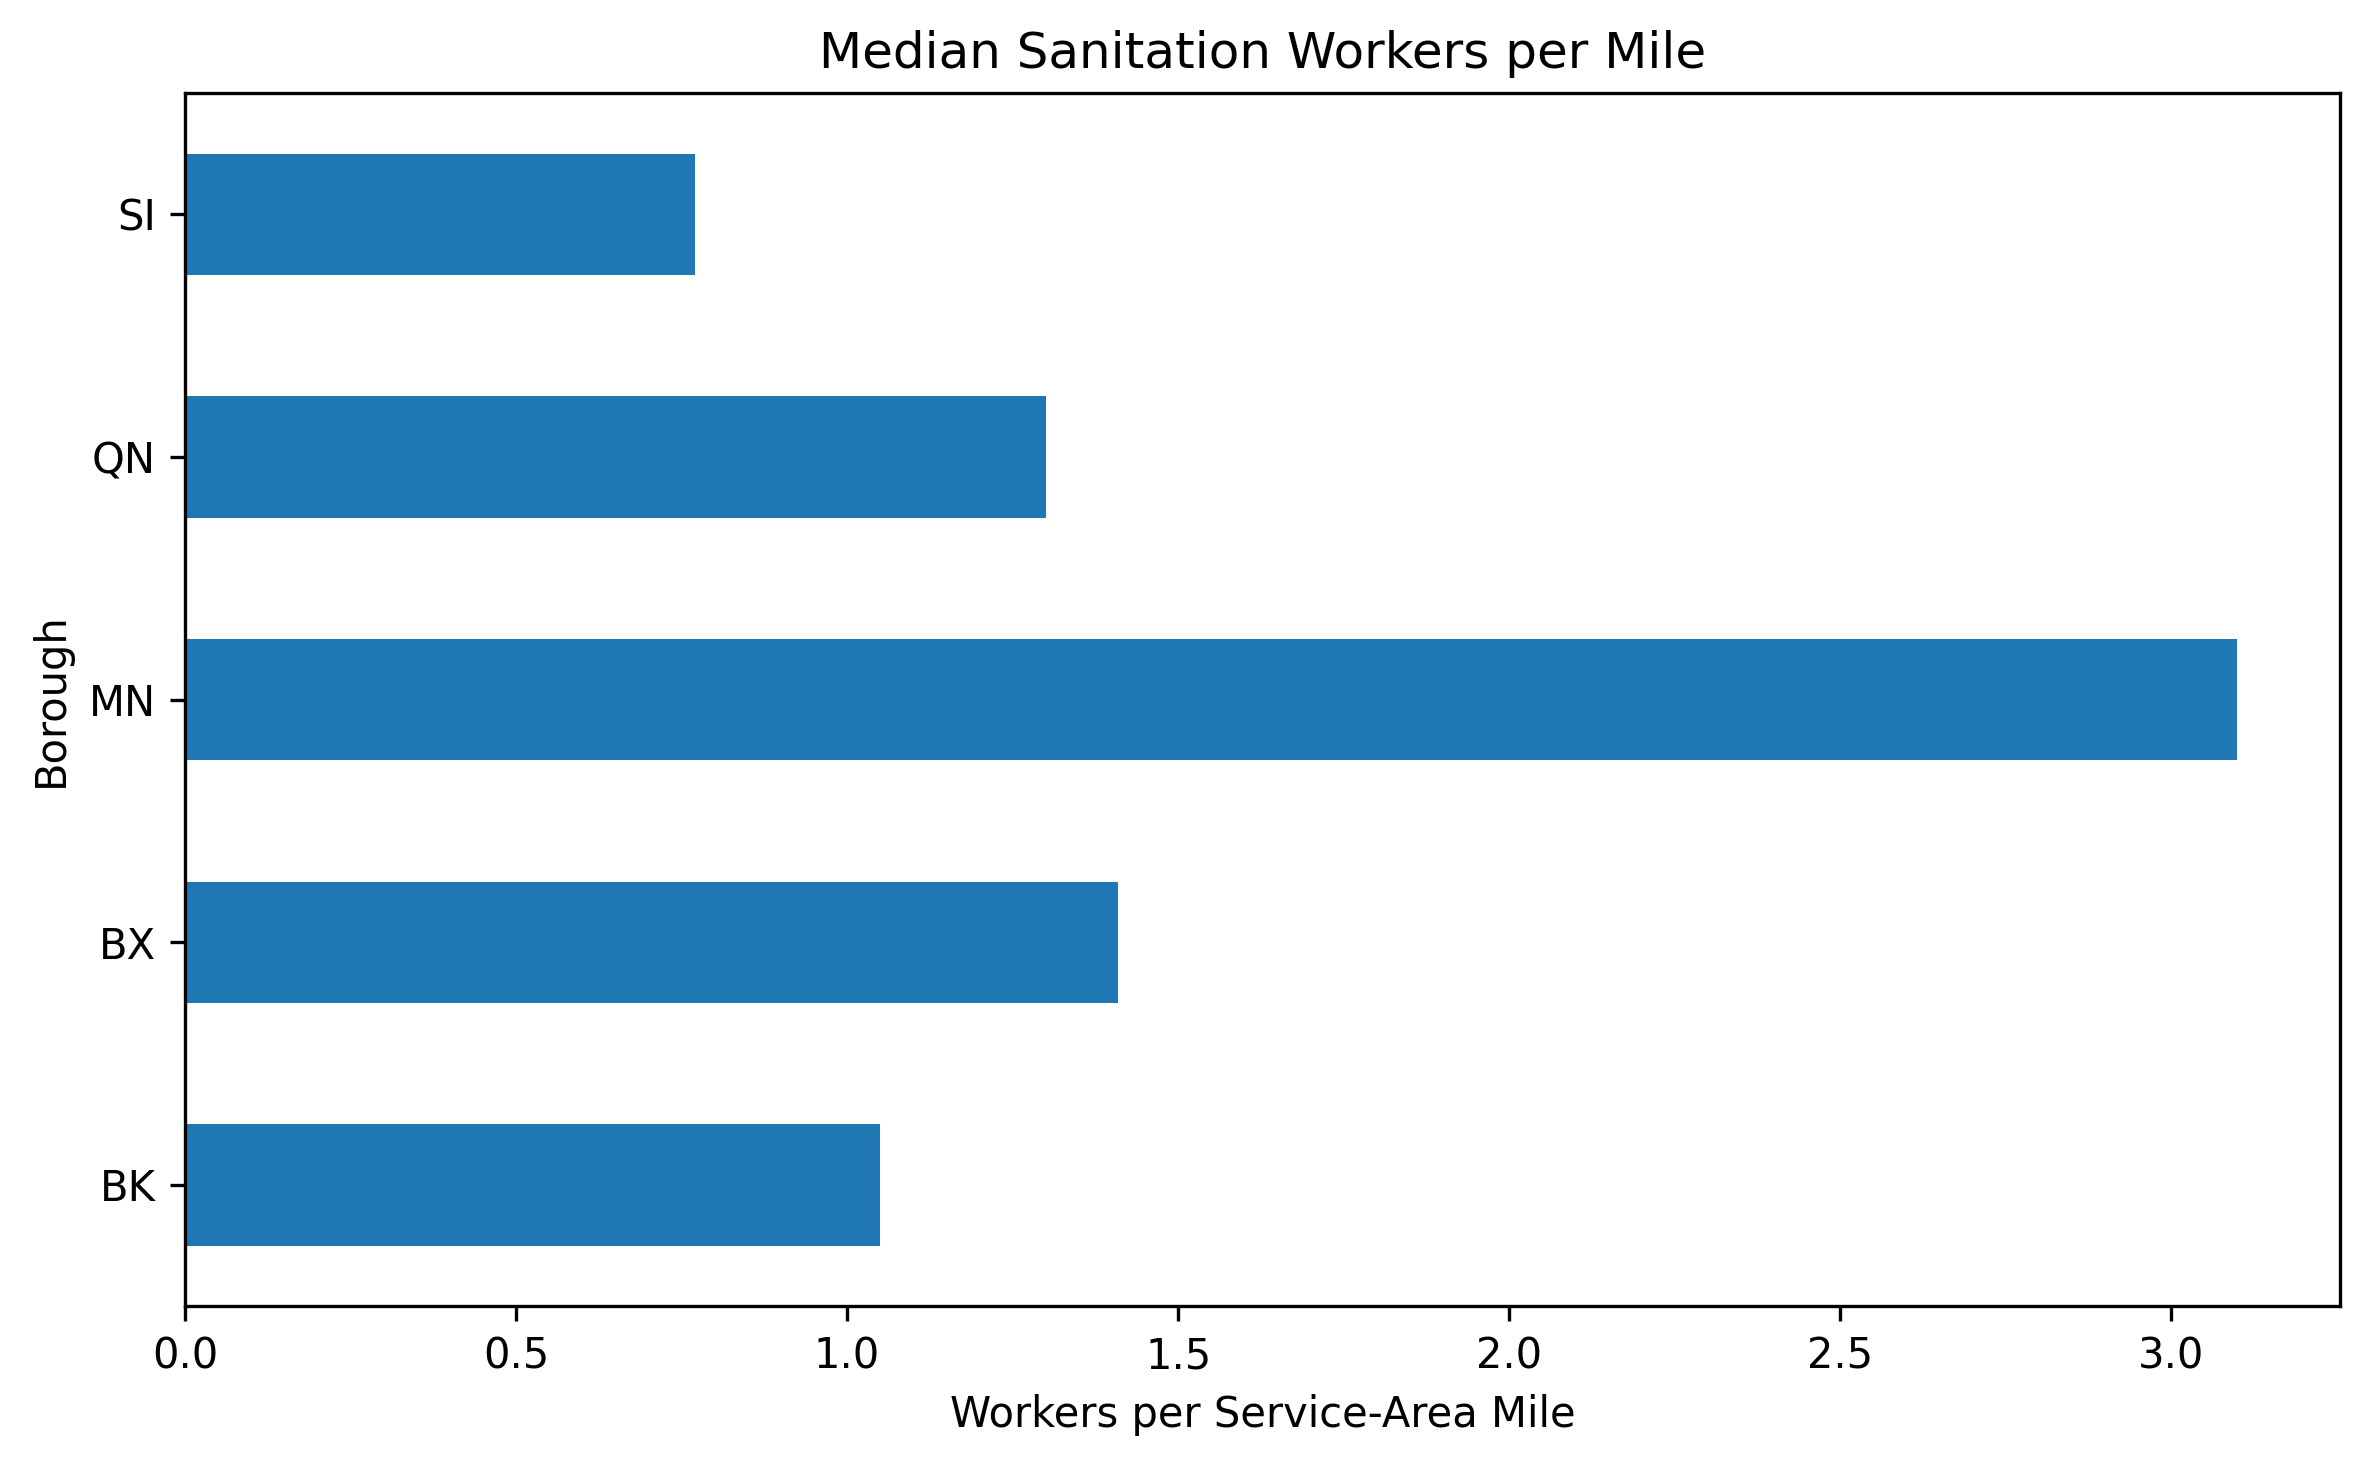
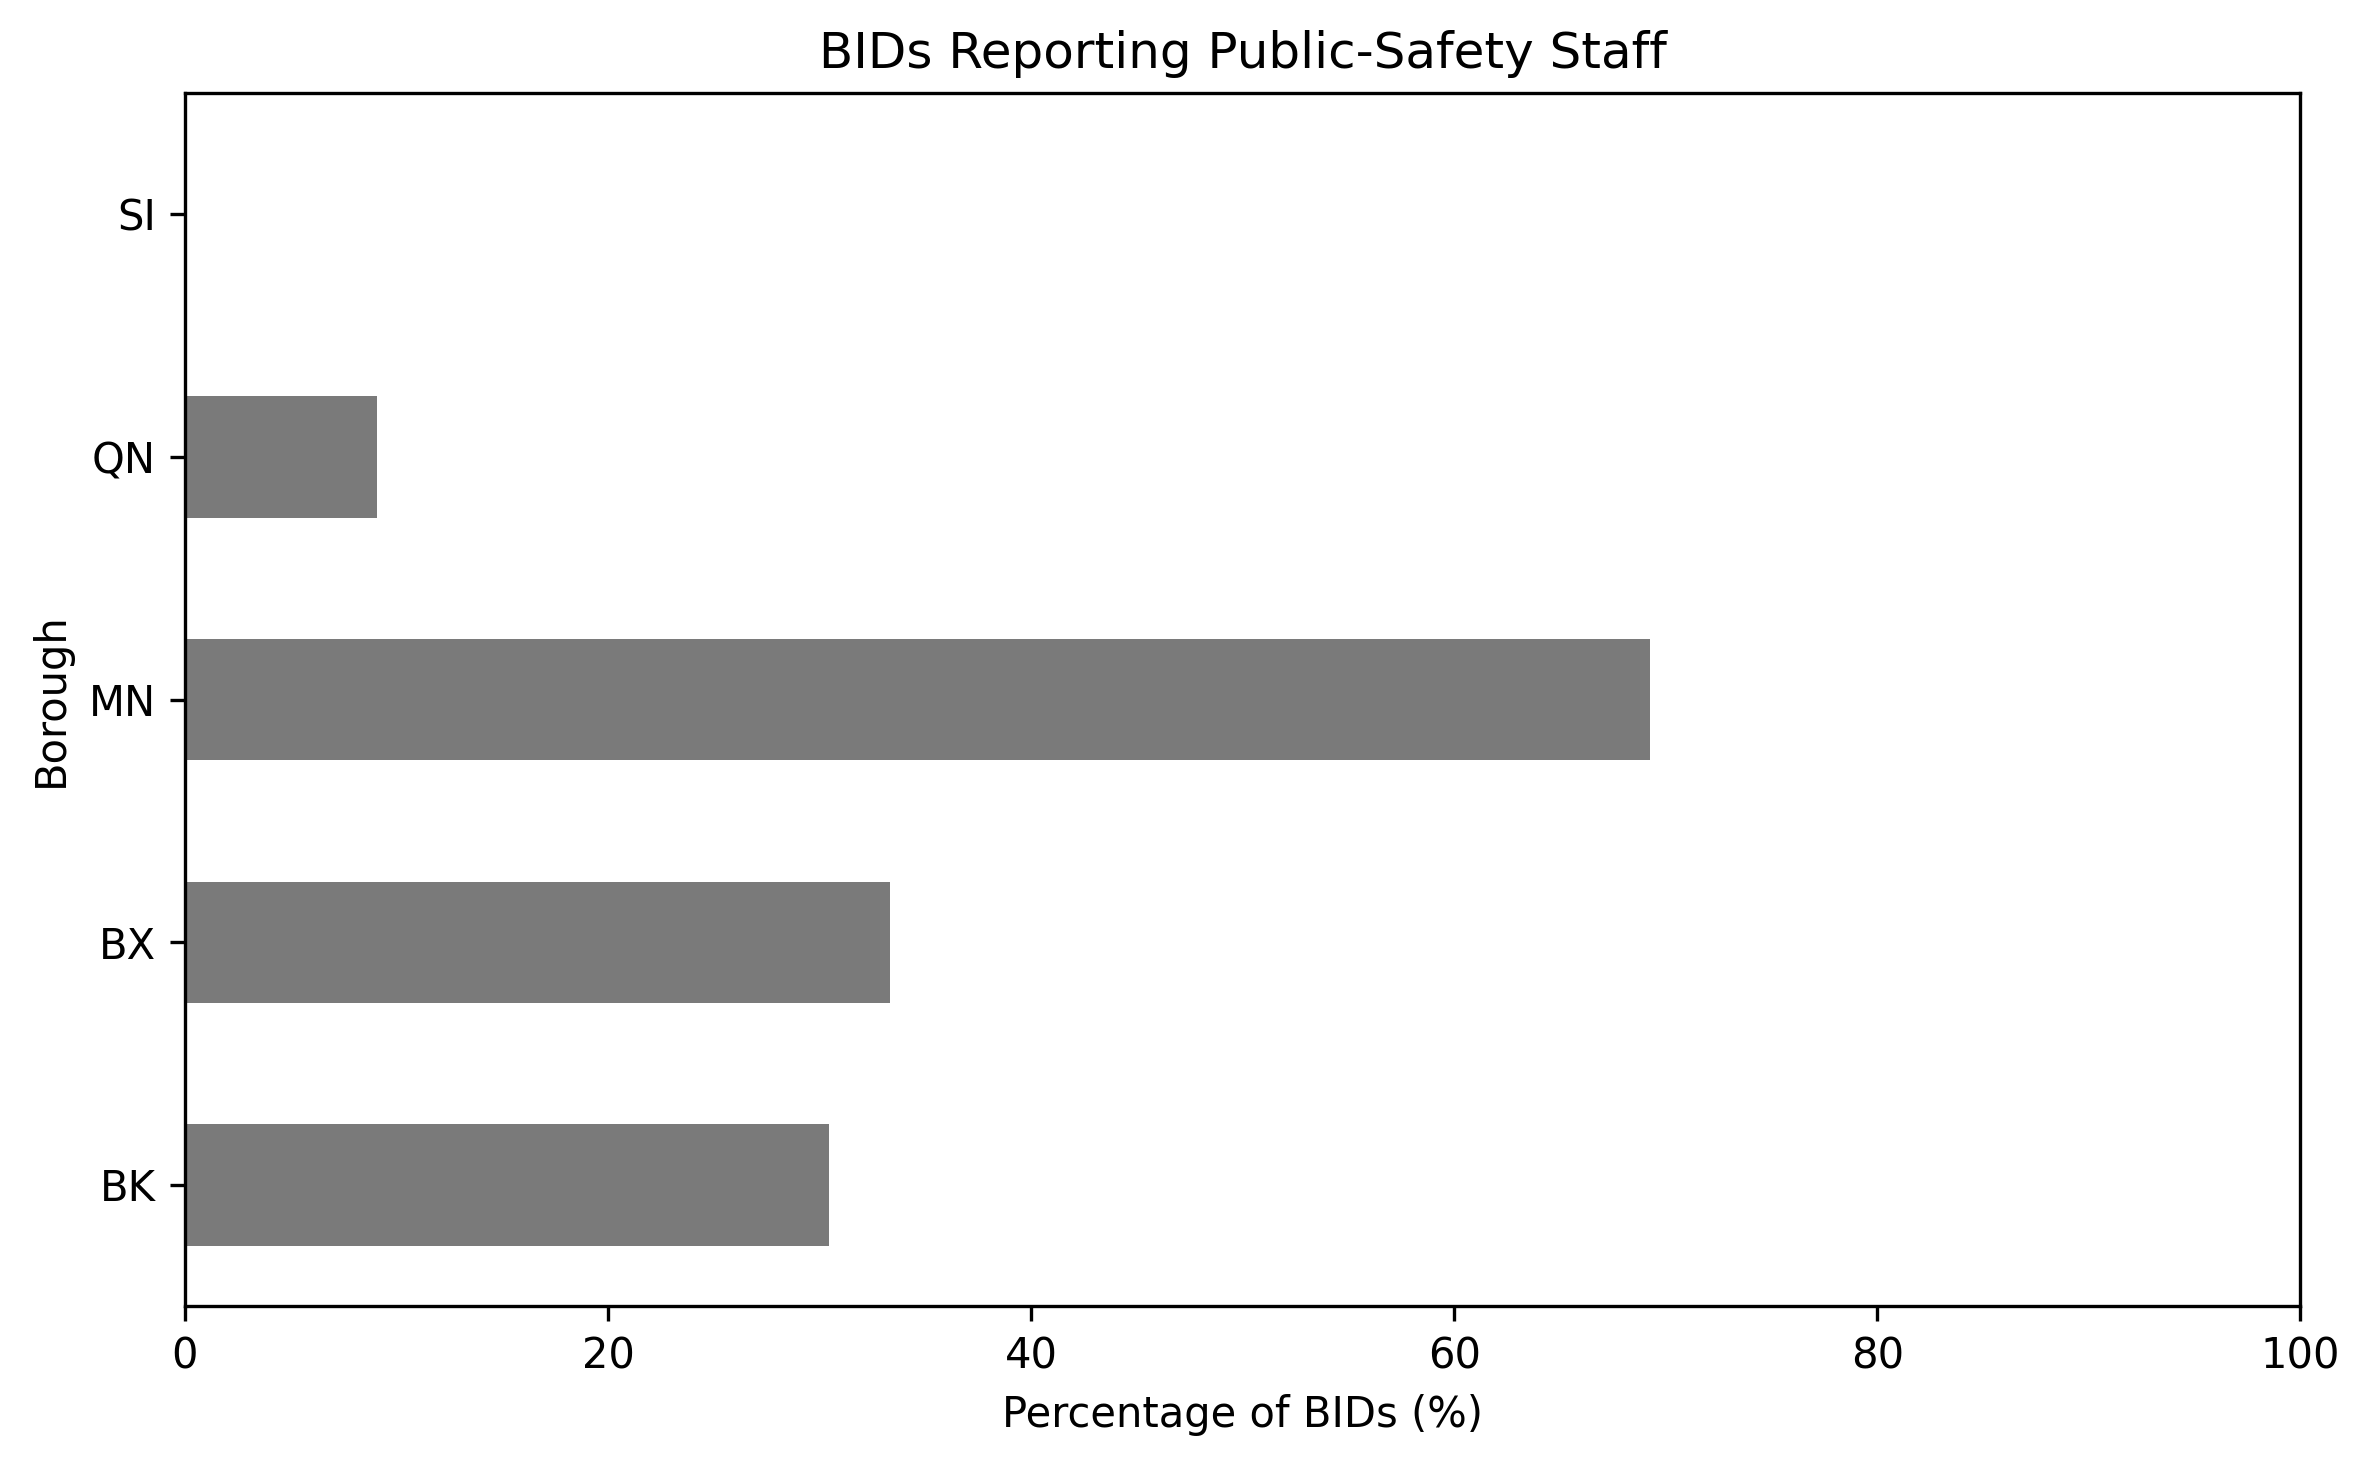
Manhattan had the highest median total staff and sanitation workers per service-area mile. Comparisons also revealed differences between BIDs reporting in-house and contracted sanitation services.
Financial Structure
Assessment revenue represented a median of 80.85% of total revenue across the BIDs analyzed. The G&A analysis also highlighted the importance of complete financial reporting when evaluating administrative spending.
Analytical Approach
The project included:
Data cleaning, data-type conversion, and missing-value assessment.
Exploratory data analysis and descriptive statistics.
Borough-level comparisons using medians and distributions.
Normalized spending and staffing measures.
Pearson and Spearman correlation analysis.
Logarithmic transformations and sensitivity analysis.
Financial ratio analysis and data visualization.
Tools & Technologies
Python | Pandas | NumPy | Matplotlib | Seaborn | adjustText | Jupyter Notebook
Data Limitations
The analysis is based on reported BID data. Reporting coverage varies across measures, and missing values are not automatically interpreted as zero.
Business counts represent BID-reported figures rather than unique citywide storefront estimates. Staffing and service activity measures reflect reported information and should not be interpreted as direct measures of efficiency or effectiveness.
Correlation results describe associations and do not establish causality.
The G&A analysis includes only BIDs with complete reporting across all six expense categories.
Explore the Project
Full Analysis: Access the complete HTML report, including the visualizations and analytical findings.
Python Notebook: Review the code, data preparation, calculations, and statistical analysis.
GitHub Repository: Explore the project files, documentation, and source code.